What changed
Deals & ownershipBetween November 4 and November 10, 2026, director Arne Alexander Wilhelmsen and his affiliate AWILHELMSEN AS sold shares of Royal Caribbean Cruises Ltd. These operations comprise two separate open market transaction reports.

Deals & ownershipПротягом тижня, що закінчився 3 листопада 2026 року, двоє інсайдерів Royal Caribbean Cruises Ltd. повідомили про продаж акцій на відкритому ринку. Ці угоди стосувалися директора компанії та її високопосадовця.

What changedRoyal Caribbean Cruises Ltd. reported $5.6 billion in revenue for the third quarter of 2026, a 9% increase year over year. Net income was $1.7 billion, with earnings per share (EPS) of $6.45.
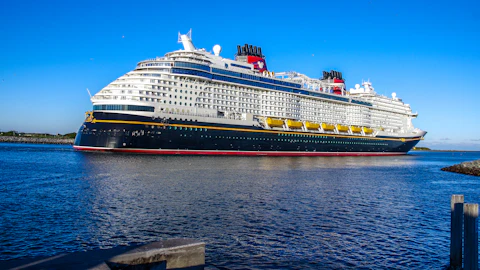
What changedRoyal Caribbean Cruises Ltd. signed definitive agreements to acquire a 50% equity interest in Sandals and Beaches Resorts for a base price of approximately $3 billion in cash, securing financing from Morgan Stanley, and Capital Research Global Investors holds 6.4% of the company's shares.

Company history
October 2026
ROYAL CARIBBEAN CRUISES LTD: 12 recorded developments from 1 official source in 2026-10.
- 2026-10-27: Revenue (us-gaap:RevenueFromContractWithCustomerExcludingAssessedTax), quarter 2026-07-01 to 2026-09-30: 5,591,000,000 USD (5.6 billion; 5,591 million); same period a year earlier (2025-07-01 to 2025-09-30): 5,139,000,000 USD (5.1 billion; 5,139 million); change +8.8% Source
- 2026-10-27: Revenue (us-gaap:RevenueFromContractWithCustomerExcludingAssessedTax), year to date 2026-01-01 to 2026-09-30: 14,876,000,000 USD (14.9 billion; 14,876 million); same period a year earlier (2025-01-01 to 2025-09-30): 13,676,000,000 USD (13.7 billion; 13,676 million); change +8.8% Source
- 2026-10-27: Operating income (us-gaap:OperatingIncomeLoss), quarter 2026-07-01 to 2026-09-30: 1,871,000,000 USD (1.9 billion; 1,871 million); same period a year earlier (2025-07-01 to 2025-09-30): 1,702,000,000 USD (1.7 billion; 1,702 million); change +9.9% Source
- 2026-10-27: Operating income (us-gaap:OperatingIncomeLoss), year to date 2026-01-01 to 2026-09-30: 4,340,000,000 USD (4.3 billion; 4,340 million); same period a year earlier (2025-01-01 to 2025-09-30): 3,977,000,000 USD (4 billion; 3,977 million); change +9.1% Source
- 2026-10-27: Net income (us-gaap:NetIncomeLoss), quarter 2026-07-01 to 2026-09-30: 1,728,000,000 USD (1.7 billion; 1,728 million); same period a year earlier (2025-07-01 to 2025-09-30): 1,575,000,000 USD (1.6 billion; 1,575 million); change +9.7% Source
- 2026-10-27: Net income (us-gaap:NetIncomeLoss), year to date 2026-01-01 to 2026-09-30: 3,798,000,000 USD (3.8 billion; 3,798 million); same period a year earlier (2025-01-01 to 2025-09-30): 3,514,000,000 USD (3.5 billion; 3,514 million); change +8.1% Source
- 2026-10-27: Operating cash flow (us-gaap:NetCashProvidedByUsedInOperatingActivities), year to date 2026-01-01 to 2026-09-30: 5,274,000,000 USD (5.3 billion; 5,274 million); same period a year earlier (2025-01-01 to 2025-09-30): 4,842,000,000 USD (4.8 billion; 4,842 million); change +8.9% Source
- 2026-10-27: Capital expenditure (us-gaap:PaymentsToAcquirePropertyPlantAndEquipment), year to date 2026-01-01 to 2026-09-30: 3,880,000,000 USD (3.9 billion; 3,880 million); same period a year earlier (2025-01-01 to 2025-09-30): 3,722,000,000 USD (3.7 billion; 3,722 million); change +4.2% Source
- 2026-10-27: Cash and cash equivalents (us-gaap:CashAndCashEquivalentsAtCarryingValue), as of 2026-09-30: 851,000,000 USD (851 million); previous balance (2025-12-31): 825,000,000 USD (825 million); change +3.2% Source
- 2026-10-27: Total assets (us-gaap:Assets), as of 2026-09-30: 44,813,000,000 USD (44.8 billion; 44,813 million); previous balance (2025-12-31): 41,619,000,000 USD (41.6 billion; 41,619 million); change +7.7% Source
- 2026-10-27: Total liabilities (us-gaap:Liabilities), as of 2026-09-30: 32,900,000,000 USD (32.9 billion; 32,900 million); previous balance (2025-12-31): 31,374,000,000 USD (31.4 billion; 31,374 million); change +4.9% Source
- 2026-10-27: Shareholders' equity (us-gaap:StockholdersEquity), as of 2026-09-30: 11,713,000,000 USD (11.7 billion; 11,713 million); previous balance (2025-12-31): 10,037,000,000 USD (10 billion; 10,037 million); change +16.7% Source
Monthly records are drafted by AI from each month’s checked filings and official sources (in English, as extracted), with every line linked to its source; storylines group related developments across analyses using vector embeddings (Amazon Titan Text Embeddings V2). Provisional context, not investment advice.
Sector peers
How this company compares with 22 covered companies in Consumer Discretionary (median revenue change +7.8% YoY), from archived SEC XBRL filings.
Latest reported period per company from SEC CompanyFacts (XBRL). Fiscal calendars differ across companies.
Expectations and reality
How expectations played out
3 of 11 expectations checked against later reports
Mostly AI assessments, provisional; an editor's decision replaces them. Not a rating of the shares.
Checked against later reports
The transaction is expected to close in early 2027, subject to customary approvals and closing conditions, and is expected to be accretive to earnings next year.
Said September 23, 2026 · Period named: early 2027 · Source · Our article
AI assessment, provisional later reports are consistent with it (as of October 27, 2026) · Later article
The transaction is expected to close in early 2027, subject to customary approvals and closing conditions.
Said September 23, 2026 · Period named: early 2027 · Source · Our article
AI assessment, provisional later reports are consistent with it (as of October 27, 2026) · Later article
Royal Caribbean Group plans to enter river cruising in 2027 with Celebrity River Cruises.
Said September 23, 2026 · Period named: in 2027 · Source · Our article
AI assessment, provisional later reports are consistent with it (as of October 27, 2026) · Later article
Open
The company remains on track to achieve Perfecta goals of delivering 20% Adjusted EPS CAGR from 2024 through 2027, or a $20-handle in 2027.
Said October 27, 2026 · Period named: 2027 · Source · Our article
AI assessment, provisional no new evidence in later reports yet (as of November 4, 2026) · Later article
Capacity changes for 2026 are expected to be 6.6% compared to 2025.
Said October 27, 2026 · Period named: 2026 · Source · Our article
AI assessment, provisional no new evidence in later reports yet (as of November 4, 2026) · Later article
The company is targeting a 20% compound annual growth rate in Adjusted EPS compared to 2024 as part of the Perfecta Program.
Said October 27, 2026 · Period named: end of 2027 · Source · Our article
AI assessment, provisional no new evidence in later reports yet (as of November 4, 2026) · Later article
Show all (11)
Capital expenditures for the full year 2026 are expected to be approximately $4.6 billion, predominantly related to the company's new ship order book and land-based destination initiatives.
Said October 27, 2026 · Period named: full year 2026 · Source · Our article
AI assessment, provisional no new evidence in later reports yet (as of November 4, 2026) · Later article
Full year Adjusted EPS is expected to be in the range of $17.85 to $17.95.
Said October 27, 2026 · Source · Our article
AI assessment, provisional no new evidence in later reports yet (as of November 4, 2026) · Later article
Capacity changes for 2027, 2028, and 2029 are expected to be approximately 4.5%, 6.0%, and 6.5%, respectively.
Said October 27, 2026 · Period named: 2027, 2028, and 2029 · Source · Our article
AI assessment, provisional no new evidence in later reports yet (as of November 4, 2026) · Later article
The investment in Sandals and Beaches Resorts is expected to close in early 2027, subject to customary closing conditions and regulatory approvals.
Said October 27, 2026 · Period named: early 2027 · Source · Our article
AI assessment, provisional no new evidence in later reports yet (as of November 4, 2026) · Later article
The company is targeting an ROIC of 17% or higher as part of the Perfecta Program.
Said October 27, 2026 · Period named: end of 2027 · Source · Our article
AI assessment, provisional no new evidence in later reports yet (as of November 4, 2026) · Later article
What management said to expect (targets, plans, forecasts) in the company's own documents (in English, as extracted), with the date and the period it named. Assessments are written by AI from the company's later reports: provisional, not checked by an editor, and a consistent later report is not proof. An editor's decision replaces them.
Insider trades
| Date | Person | Trade | Shares | Avg. price | Value | Filing |
|---|
| November 13, 2026 | Arne Alexander Wilhelmsen | Sale | 88,326 | $321.80 | $28,423,655 | SEC |
| November 12, 2026 | Arne Alexander Wilhelmsen | Sale | 185,000 | $335.73 | $62,109,253 | SEC |
| November 10, 2026 | Arne Alexander Wilhelmsen | Sale | 476,674 | $335.29 | $159,824,006 | SEC |
| November 9, 2026 | Awilhelmsen As | Planned sale | 500,000 | — | $170,500,000 | SEC |
| November 5, 2026 | Arne Alexander Wilhelmsen | Sale | 250,000 | $328.56 | $82,140,413 | SEC |
| November 4, 2026 | Awilhelmsen As | Planned sale | 500,000 | — | $166,500,000 | SEC |
| November 2, 2026 | Robert Alexander Lake | Sale | 1,000 | $315.00 | $315,000 | SEC |
| October 30, 2026 | Maritza Gomez Montiel | Sale | 400 | $307.21 | $122,884 | SEC |
| October 30, 2026 | Maritza Montiel | Planned sale | 400 | — | $122,884 | SEC |
| October 28, 2026 | Robert Alexander Lake | Sale | 1,000 | $298.43 | $298,430 | SEC |
All insider trades →
Large funds (13F)
| Fund | Shares | Value | Change in shares | Quarter |
|---|
| BlackRock | 20,075,354 | $5,337,233,465 | -2.7% | Q3 2026 |
| Capital Research Global Investors | 17,148,752 | $4,559,062,630 | -49.9% | Q3 2026 |
| State Street | 10,806,077 | $2,888,908,396 | +1.1% | Q3 2026 |
| Geode Capital Management | 7,006,404 | $1,855,825,596 | +0.9% | Q3 2026 |
| Norges Bank (Norway's sovereign fund) | 1,609,113 | $510,941,651 | — | Q2 2026 |
| Citadel Advisors | 1,825,218 | $485,252,457 | +1,561.5% | Q3 2026 |
| Wellington Management | 757,517 | $201,393,470 | +7.9% | Q3 2026 |
| Fidelity (FMR) | 723,715 | $192,407,095 | -15.9% | Q3 2026 |
| D. E. Shaw & Co. | 265,547 | $70,598,326 | +230.2% | Q3 2026 |
| Millennium Management | 73,143 | $19,445,798 | -72.6% | Q3 2026 |
| Two Sigma Investments | 2,750 | $731,115 | -89.5% | Q3 2026 |
| Bridgewater Associates | 1,287 | $408,661 | — | Q2 2026 |
| T. Rowe Price | 1,060,849 | $282,038 | -10.1% | Q3 2026 |
From the quarterly 13F-HR holdings reports of the large funds we follow, as filed. Funds file up to 45 days after the quarter ends, so positions may have changed since. Change: against the same fund's previous quarter. Not a recommendation.