What changed
What changedBetween November 14 and November 16, 2026, Delta Air Lines focused on resuming operations after an FAA-mandated ground stop and announced a new partnership with World of Hyatt. Separately, a November 16 regulatory filing confirmed that Warren Buffett, Berkshire Hathaway Inc., and National Indemnity Company collectively own 9.8% of Delta Air Lines shares.

What changedOn November 13, 2026, Delta Air Lines resumed flights after the Federal Aviation Administration (FAA) lifted a nationwide ground stop. The company began positioning aircraft and crews to restore full operations.

What changedDelta TechOps signed a five-year agreement to provide fleet maintenance for Virgin Australia, while the airline expanded its Pacific presence. These steps highlight the company's strategy to strengthen technical support for customers and expand route networks, notably via the recent launch of Los Angeles-Melbourne flights.

What changedКомпанія Delta Air Lines завершила публічне розміщення незабезпечених облігацій на загальну суму $500 млн із терміном погашення у листопаді 2029 року. Ця угода, завершена 6 листопада 2026 року, є частиною заходів компанії з управління запозиченнями.

What changedHeathrow Airport decided to move Delta Air Lines operations to Terminal 4. Chief executive officer Ed Bastian called the move short-sighted and harmful to consumers.

Show all articles (7)
What changedDelta TechOps signed an agreement with Aeroitalia to service its Boeing 737 fleet and hit $1 billion in year-to-date maintenance, repair, and overhaul (MRO) revenue. Simultaneously, Chief Executive Officer Edward H. Bastian filed a notice of a proposed sale of 50,000 company shares.
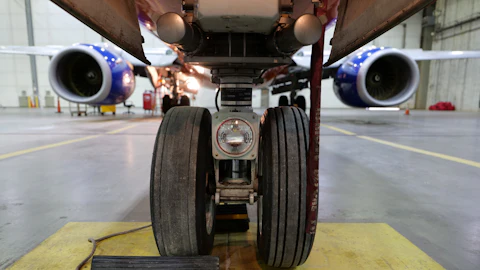
What changedDelta Air Lines in a press release dated Oct. 9, 2026 said it posted record revenue of $17.6 billion, EPS of $1.72, free cash flow of $463 million and adjusted net debt of $13.4 billion.

Company history
How stories developed
Monthly timeline
October 2026
DELTA AIR LINES, INC.: 12 recorded developments from 1 official source in 2026-10.
- 2026-10-09: Revenue (us-gaap:RevenueFromContractWithCustomerExcludingAssessedTax), quarter 2026-07-01 to 2026-09-30: 20,186,000,000 USD (20.2 billion; 20,186 million); same period a year earlier (2025-07-01 to 2025-09-30): 16,673,000,000 USD (16.7 billion; 16,673 million); change +21.1% Source
- 2026-10-09: Revenue (us-gaap:RevenueFromContractWithCustomerExcludingAssessedTax), year to date 2026-01-01 to 2026-09-30: 55,797,000,000 USD (55.8 billion; 55,797 million); same period a year earlier (2025-01-01 to 2025-09-30): 47,361,000,000 USD (47.4 billion; 47,361 million); change +17.8% Source
- 2026-10-09: Operating income (us-gaap:OperatingIncomeLoss), quarter 2026-07-01 to 2026-09-30: 1,454,000,000 USD (1.5 billion; 1,454 million); same period a year earlier (2025-07-01 to 2025-09-30): 1,684,000,000 USD (1.7 billion; 1,684 million); change -13.7% Source
- 2026-10-09: Operating income (us-gaap:OperatingIncomeLoss), year to date 2026-01-01 to 2026-09-30: 3,819,000,000 USD (3.8 billion; 3,819 million); same period a year earlier (2025-01-01 to 2025-09-30): 4,355,000,000 USD (4.4 billion; 4,355 million); change -12.3% Source
- 2026-10-09: Net income (us-gaap:NetIncomeLoss), quarter 2026-07-01 to 2026-09-30: 756,000,000 USD (756 million); same period a year earlier (2025-07-01 to 2025-09-30): 1,417,000,000 USD (1.4 billion; 1,417 million); change -46.6% Source
- 2026-10-09: Net income (us-gaap:NetIncomeLoss), year to date 2026-01-01 to 2026-09-30: 2,070,000,000 USD (2.1 billion; 2,070 million); same period a year earlier (2025-01-01 to 2025-09-30): 3,786,000,000 USD (3.8 billion; 3,786 million); change -45.3% Source
- 2026-10-09: Diluted EPS (us-gaap:EarningsPerShareDiluted), year to date 2026-01-01 to 2026-09-30: 3.15 USD/shares; same period a year earlier (2025-01-01 to 2025-09-30): 5.8 USD/shares; change -45.7% Source
- 2026-10-09: Operating cash flow (us-gaap:NetCashProvidedByUsedInOperatingActivities), year to date 2026-01-01 to 2026-09-30: 5,740,000,000 USD (5.7 billion; 5,740 million); same period a year earlier (2025-01-01 to 2025-09-30): 6,082,000,000 USD (6.1 billion; 6,082 million); change -5.6% Source
- 2026-10-09: Cash and cash equivalents (us-gaap:CashAndCashEquivalentsAtCarryingValue), as of 2026-09-30: 3,787,000,000 USD (3.8 billion; 3,787 million); previous balance (2025-12-31): 4,310,000,000 USD (4.3 billion; 4,310 million); change -12.1% Source
- 2026-10-09: Total assets (us-gaap:Assets), as of 2026-09-30: 86,048,000,000 USD (86 billion; 86,048 million); previous balance (2025-12-31): 81,317,000,000 USD (81.3 billion; 81,317 million); change +5.8% Source
- 2026-10-09: Shareholders' equity (us-gaap:StockholdersEquity), as of 2026-09-30: 22,513,000,000 USD (22.5 billion; 22,513 million); previous balance (2025-12-31): 20,853,000,000 USD (20.9 billion; 20,853 million); change +8% Source
- 2026-10-09: Long-term debt (us-gaap:LongTermDebtNoncurrent), as of 2026-09-30: 9,124,000,000 USD (9.1 billion; 9,124 million); previous balance (2025-12-31): 11,936,000,000 USD (11.9 billion; 11,936 million); change -23.6% Source
July 2026
Delta Air Lines filed its quarterly report for the period ending June 30, 2026, detailing financial performance and regulatory disclosures.
- On July 10, 2026, Delta reported adjusted total revenue of $17,666 million for the three months ended June 30, 2026, compared to $15,507 million for the same period in 2025. Source
- The company noted that beginning in 2026, settlement gains and losses related to Monroe's inventory remaining on‑hand at period end are excluded from adjusted results. Source
- In the July 10, 2026 filing, management concluded that disclosure controls were effective as of June 30, 2026, and no changes to internal control over financial reporting materially affected the controls during the quarter. Source
- The Chief Executive Officer and Chief Financial Officer certified the Quarterly Report on Form 10‑Q for the quarter ended June 30, 2026, as disclosed on July 10, 2026. Source
- Ernst & Young LLP provided a letter regarding the unaudited interim financial information contained in the July 2026 quarterly report. Source
- The company's July 2026 filing disclosed a Credit Agreement dated June 11, 2026, with JPMorgan Chase Bank, N.A., and a Third Amendment to its Term Loan Credit and Guaranty Agreement dated April 24, 2026. Source
Monthly records are drafted by AI from each month’s checked filings and official sources (in English, as extracted), with every line linked to its source; storylines group related developments across analyses using vector embeddings (Amazon Titan Text Embeddings V2). Provisional context, not investment advice.
Sector peers
How this company compares with 55 covered companies in Industrials (median revenue change +11.9% YoY), from archived SEC XBRL filings.
Latest reported period per company from SEC CompanyFacts (XBRL). Fiscal calendars differ across companies.
Expectations and reality
How expectations played out
1 of 4 expectations checked against later reports
Mostly AI assessments, provisional; an editor's decision replaces them. Not a rating of the shares.
Checked against later reports
Delta has a plan to pay down more than $2 billion of debt in 2026.
Said October 9, 2026 · Period named: 2026 · Source · Our article
AI assessment, provisional later reports are consistent with it (as of November 6, 2026) · Later article
Open
In the December quarter, we expect earnings of $1.15 to $1.65 per share, based on a fuel price of approximately $4.25 per gallon
Said October 9, 2026 · Period named: December quarter · Source · Our article
AI assessment, provisional no new evidence in later reports yet (as of November 5, 2026) · Later article
For the full year, we expect to deliver free cash flow of approximately $2.5 billion and pay down more than $2 billion of debt, positioning us to end the year with gross leverage of approximately 2.2x
Said October 9, 2026 · Source · Our article
AI assessment, provisional no new evidence in later reports yet (as of October 29, 2026) · Later article
With slightly higher capacity and continued operational efficiencies, we expect December quarter non-fuel unit cost growth to improve 1 to 2 points sequentially
Said October 9, 2026 · Period named: December quarter · Source · Our article
AI assessment, provisional no new evidence in later reports yet (as of October 29, 2026) · Later article
What management said to expect (targets, plans, forecasts) in the company's own documents (in English, as extracted), with the date and the period it named. Assessments are written by AI from the company's later reports: provisional, not checked by an editor, and a consistent later report is not proof. An editor's decision replaces them.
Changes in risk factors
The 10-Q filed October 9, 2026 compared with the 10-Q filed July 10, 2026: risk paragraphs that were added or dropped, quoted as filed. SEC
Added (8)
- | 660 | | $ | — | | $ | 11,883 | | $ | 13,343 | | $ | (4,135) | | 6 | | $ | (238) | | $ | 20,853
- | 666 | | $ | — | | $ | 11,944 | | $ | 12,931 | | $ | (4,106) | | 9 | | $ | (393) | | $ | 20,376
- | 666 | | $ | — | | $ | 12,016 | | $ | 14,269 | | $ | (4,074) | | 9 | | $ | (396) | | $ | 21,815
Dropped (10)
- Total liabilities and stockholders' equity | $ | 86,321 | | | $ | 81,317
- Net Cash Provided by Operating Activities | $ | 4,027 | | | $ | 4,235
- Net cash used in investing activities | (2,775) | | | (2,423)
Found by comparing the two reports paragraph by paragraph, without AI. A new or dropped risk is not by itself a sign of trouble.
Insider trades
| Date | Person | Trade | Shares | Avg. price | Value | Filing |
|---|
| November 12, 2026 | Steven M Sear | Sale notice filed | 17,768 | $88.96 | $1,580,552 | SEC |
| November 6, 2026 | Alain Bellemare | Sale notice filed | 28,000 | $85.93 | $2,406,132 | SEC |
| November 4, 2026 | Peter W Carter | Sale notice filed | 44,950 | $89.29 | $4,013,451 | SEC |
| October 29, 2026 | Edward H Bastian | Sale notice filed | 50,000 | $82.00 | $4,100,000 | SEC |
All insider trades →
Large funds (13F)
| Fund | Shares | Value | Change in shares | Quarter |
|---|
| Berkshire Hathaway | 64,450,000 | $5,378,997,000 | +12.4% | Q3 2026 |
| BlackRock | 41,608,636 | $3,472,656,752 | -7.8% | Q3 2026 |
| Fidelity (FMR) | 30,621,052 | $2,555,632,893 | -7.7% | Q3 2026 |
| State Street | 22,052,323 | $1,840,486,878 | -8.6% | Q3 2026 |
| Geode Capital Management | 17,102,749 | $1,427,763,558 | -7.6% | Q3 2026 |
| Wellington Management | 3,125,173 | $260,826,938 | -10.5% | Q3 2026 |
| Norges Bank (Norway's sovereign fund) | 715,051 | $66,971,677 | — | Q2 2026 |
| Millennium Management | 601,889 | $50,233,656 | +9,069.5% | Q3 2026 |
| Citadel Advisors | 348,289 | $29,068,200 | +6.6% | Q3 2026 |
| D. E. Shaw & Co. | 183,514 | $15,316,078 | +189.8% | Q3 2026 |
| Bridgewater Associates | 44,185 | $3,687,680 | +97.7% | Q3 2026 |
| Two Sigma Investments | 22,246 | $2,083,560 | — | Q2 2026 |
| T. Rowe Price | 1,125,688 | $93,951 | -5.1% | Q3 2026 |
| Duquesne Family Office (Stanley Druckenmiller) | 603,000 | $56,477 | — | Q2 2026 |
From the quarterly 13F-HR holdings reports of the large funds we follow, as filed. Funds file up to 45 days after the quarter ends, so positions may have changed since. Change: against the same fund's previous quarter. Not a recommendation.

