Qué cambió
Qué cambióNextEra Energy ganó 2,28 $ de beneficio neto por acción en el tercer trimestre de 2026, frente a 1,18 $ un año antes. Sin la revalorización de sus contratos de cobertura, el beneficio por acción ajustado subió de forma más moderada, hasta 1,24 $.
Historial de la empresa
Octubre 2026
NEXTERA ENERGY INC: 12 recorded developments from 1 official source in 2026-10.
- 2026-10-21: After-tax net gains associated with non-qualifying hedge activity were $2,246 (millions) in the three months ended September 30, 2026 versus $52 in 2025. Fuente
- 2026-10-21: The change in non-qualifying hedge activity is primarily attributable to changes in forward power and natural gas prices, interest rates and foreign currency exchange rates, and the reversal of previously recognized unrealized mark-to-market gains or losses. Fuente
- 2026-10-21: Corporate and Other net income attributable to NEE was 1,664 (millions) in the three months ended September 30, 2026 versus (300) in 2025. Fuente
- 2026-10-21: Net income attributable to NEE increased $2,337 million for the three months ended September 30, 2026, reflecting higher results at FPL, NEER and Corporate and Other. Fuente
- 2026-10-21: Corporate and Other's results increased primarily due to favorable non-qualifying hedge activity compared to 2025, partly offset by higher interest expense. Fuente
- 2026-10-21: Non-qualifying hedges are economic hedges marked to market in the income statement, resulting in earnings volatility because the economic offset to certain positions is generally not marked to market. Fuente
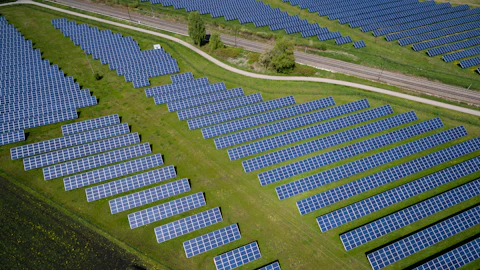
- 2026-10-21: FPL's average rate base grew by approximately $6.8 billion for the three months ended September 30, 2026, reflecting solar generation additions and transmission and distribution additions. Fuente
- 2026-10-21: During the three months ended September 30, 2026, FPL recorded the reversal of RSM amortization of approximately $172 million, after tax, in accordance with the 2025 rate agreement. Fuente
- 2026-10-21: FPL earned a regulatory ROE of approximately 11.80% on its retail rate base as of September 30, 2026. Fuente
- 2026-10-21: Challenges to the FPSC's order approving FPL's 2025 rate agreement remain pending before the Florida Supreme Court, which consolidated the appeals in June 2026. Fuente
- 2026-10-21: In October 2026, Hurricane Isaias made landfall near the Florida panhandle causing damage to FPL's service territory. Fuente
- 2026-10-21: FPL operating revenues increased $136 million in the three months ended September 30, 2026; retail base revenues rose approximately $368 million, partly offset by approximately $452 million lower storm cost recovery revenues. Fuente
Los registros mensuales los redacta la IA a partir de los informes y fuentes oficiales verificados de cada mes (en inglés, tal como se extrajeron), y cada línea enlaza su fuente; las líneas argumentales agrupan hechos relacionados entre análisis mediante embeddings vectoriales (Amazon Titan Text Embeddings V2). Contexto provisional, no es asesoramiento de inversión.
Comparables del sector
Comparación con 7 empresas seguidas en Servicios públicos (mediana de ingresos +13,2% a/a), según datos XBRL de la SEC.
| Empresa | Últimos ingresos | Ingresos a/a | Margen operativo |
|---|
| Nextera Energy Inc NEE | — | — | — |
| ONEOK Inc OKE | 12,5 mil M $ | +44,3% | 12,6% |
| Vistra Corp. VST | 6 mil M $ | +25,4% | 28,5% |
| Constellation Energy Corp CEG | 5,8 mil M $ | +13,2% | 9,9% |
| Atmos Energy Corp ATO | 5 mil M $ | +5,9% | 37,3% |
| Venture Global, Inc. VG | 4,8 mil M $ | +42,9% | 48,3% |
| Republic Services, Inc. RSG | 4,6 mil M $ | +8,2% | 20,2% |
Último periodo reportado por empresa en SEC CompanyFacts (XBRL). Los calendarios fiscales pueden diferir.
Expectativas y realidad
Abiertas
NextEra Energy expects to grow adjusted earnings per share at a compound annual growth rate of 8%+ through 2032, off the 2025 base.
Dicho el 21 de octubre de 2026 · Periodo indicado: through 2032 · Fuente · Nuestro análisis
Aún no contrastada con informes posteriores.
NextEra Energy expects 2026 adjusted earnings per share of $3.92 to $4.02 and targets the high end of that range.
Dicho el 21 de octubre de 2026 · Periodo indicado: 2026 · Fuente · Nuestro análisis
Aún no contrastada con informes posteriores.
FPL's full-year capital investments are expected to be approximately $12 billion.
Dicho el 21 de octubre de 2026 · Fuente · Nuestro análisis
Aún no contrastada con informes posteriores.
NextEra Energy expects dividends per share to grow 6% per year from year-end 2026 through 2028.
Dicho el 21 de octubre de 2026 · Periodo indicado: from year-end 2026 through 2028 · Fuente · Nuestro análisis
Aún no contrastada con informes posteriores.
The companies continue to expect the combination with Dominion Energy to close in the second half of 2027.
Dicho el 21 de octubre de 2026 · Periodo indicado: the second half of 2027 · Fuente · Nuestro análisis
Aún no contrastada con informes posteriores.
The combined company is expected to support 9%+ adjusted earnings per share growth through 2032, with a 9%+ target through 2035, off a 2025 base.
Dicho el 21 de octubre de 2026 · Periodo indicado: through 2032 · Fuente · Nuestro análisis
Aún no contrastada con informes posteriores.
Lo que la dirección dijo que cabía esperar en los propios documentos de la empresa (objetivos, planes, previsiones; en inglés, tal como se extrajo), con la fecha y el periodo indicado. Las valoraciones las escribe la IA a partir de informes posteriores: provisionales, no revisadas por un editor, y un informe posterior coherente no es una prueba. La decisión de un editor las sustituye.
Cambios en los factores de riesgo
El 10-Q del 21 de octubre de 2026 comparado con el 10-Q del 24 de julio de 2026: párrafos de riesgo añadidos o eliminados, citados tal como se presentaron. SEC
Añadidos (70)
- Proceeds from differential membership investors | | 1,334 | | | 1,065
- Payments to differential membership investors | | (597) | | | (166)
- Proceeds from sale of project minority interests | | 1,559 | | | —
Eliminados (56)
- Cost recovery clauses and franchise fees | | (7) | | | (159)
- Balances, March 31, 2026 | 2,085 | | | $ | 21 | | | $ | 19,251 | | | $ | (34) | | | $ | 35,984 | | | $ | 55,222 | | | $ | 11,410 | | | $ | 66,632 | | | $ | —
- | — | | | — | | | — | | | — | | | (1,300) | | | (1,300) | | | — | | | | | —
Detectado comparando los dos informes párrafo a párrafo, sin IA. Un riesgo nuevo o eliminado no es por sí mismo señal de problemas.
Grandes fondos (13F)
| Fondo | Acciones | Valor | Cambio en acciones | Trimestre |
|---|
| BlackRock | 198.163.460 | $15.008.900.467 | +6,1% | T3 2026 |
| State Street | 123.652.960 | $9.365.475.190 | +4,0% | T3 2026 |
| Geode Capital Management | 49.669.724 | $3.748.535.326 | -0,6% | T3 2026 |
| Norges Bank (Norway's sovereign fund) | 32.117.624 | $2.818.963.858 | — | T2 2026 |
| Fidelity (FMR) | 24.397.045 | $1.847.832.128 | -17,5% | T3 2026 |
| Capital Research Global Investors | 20.246.855 | $1.533.497.589 | +0,7% | T3 2026 |
| Millennium Management | 7.829.103 | $592.976.261 | +2279,6% | T3 2026 |
| Wellington Management | 2.460.003 | $186.320.627 | -40,2% | T3 2026 |
| Citadel Advisors | 1.582.327 | $119.845.447 | +70,0% | T3 2026 |
| Renaissance Technologies | 925.500 | $70.097.370 | — | T3 2026 |
| D. E. Shaw & Co. | 478.676 | $36.254.920 | +284,9% | T3 2026 |
| Two Sigma Investments | 84.520 | $6.401.545 | +1590,4% | T3 2026 |
| T. Rowe Price | 17.024.854 | $1.289.464 | -8,0% | T3 2026 |
| Bridgewater Associates | 7838 | $593.650 | -68,5% | T3 2026 |
De los informes trimestrales 13F-HR de los grandes fondos que seguimos, tal como se presentaron. Los fondos informan hasta 45 días después del cierre del trimestre, por lo que las posiciones pueden haber cambiado. Cambio: frente al trimestre anterior del mismo fondo. No es una recomendación.