Was sich geändert hat
Deals & BeteiligungenDavid Bernstein, Chief Financial and Administrative Officer bei Carnival Corp Ltd., verkaufte am 4. November 2026 insgesamt 26.681 Aktien. Der Gesamtwert der veräußerten Aktien belief sich auf 834.064,07 $.

Was sich geändert hatCarnival Corporation Ltd. führte ein Commercial-Paper-Programm mit einem Volumen von bis zu 2,0 Mrd. $ ein, das von Carnival UK Ltd. garantiert wird. Die Initiative stellt dem Unternehmen einen kurzfristigen Finanzierungsmechanismus zur Verfügung, während die Tochtergesellschaft die rechtliche Zahlungsverpflichtung übernimmt.

Was sich geändert hatCarnival Corp reported record net income of $1.9 bn and record customer deposits of $7.6 bn in its third‑quarter 2026 report.
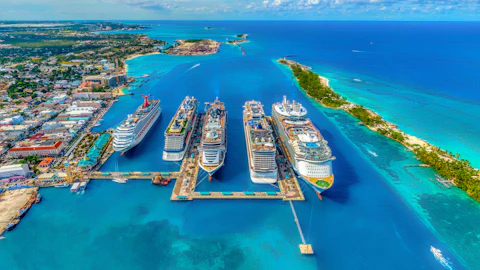
Unternehmensverlauf
Oktober 2026
Carnival Corp Ltd.: 1 recorded development from 1 official source in 2026-10.
- 2026-10-28: Units to be sold: 25000; aggregate market value: 652750 USD; units outstanding: 1344610129 Quelle
September 2026
Carnival Corp Ltd.: 12 recorded developments from 1 official source in 2026-09.
- 2026-09-29: Revenue (us-gaap:RevenueFromContractWithCustomerExcludingAssessedTax), quarter 2026-06-01 to 2026-08-31: 8,435,000,000 USD (8.4 billion; 8,435 million); same period a year earlier (2025-06-01 to 2025-08-31): 8,153,000,000 USD (8.2 billion; 8,153 million); change +3.5% Quelle
- 2026-09-29: Revenue (us-gaap:RevenueFromContractWithCustomerExcludingAssessedTax), year to date 2025-12-01 to 2026-08-31: 21,263,000,000 USD (21.3 billion; 21,263 million); same period a year earlier (2024-12-01 to 2025-08-31): 20,292,000,000 USD (20.3 billion; 20,292 million); change +4.8% Quelle
- 2026-09-29: Operating income (us-gaap:OperatingIncomeLoss), quarter 2026-06-01 to 2026-08-31: 2,220,000,000 USD (2.2 billion; 2,220 million); same period a year earlier (2025-06-01 to 2025-08-31): 2,271,000,000 USD (2.3 billion; 2,271 million); change -2.2% Quelle
- 2026-09-29: Operating income (us-gaap:OperatingIncomeLoss), year to date 2025-12-01 to 2026-08-31: 3,678,000,000 USD (3.7 billion; 3,678 million); same period a year earlier (2024-12-01 to 2025-08-31): 3,748,000,000 USD (3.7 billion; 3,748 million); change -1.9% Quelle
- 2026-09-29: Net income (us-gaap:NetIncomeLoss), quarter 2026-06-01 to 2026-08-31: 1,920,000,000 USD (1.9 billion; 1,920 million); same period a year earlier (2025-06-01 to 2025-08-31): 1,852,000,000 USD (1.9 billion; 1,852 million); change +3.7% Quelle
- 2026-09-29: Net income (us-gaap:NetIncomeLoss), year to date 2025-12-01 to 2026-08-31: 2,715,000,000 USD (2.7 billion; 2,715 million); same period a year earlier (2024-12-01 to 2025-08-31): 2,338,000,000 USD (2.3 billion; 2,338 million); change +16.1% Quelle
- 2026-09-29: Operating cash flow (us-gaap:NetCashProvidedByUsedInOperatingActivities), year to date 2025-12-01 to 2026-08-31: 5,303,000,000 USD (5.3 billion; 5,303 million); same period a year earlier (2024-12-01 to 2025-08-31): 4,700,000,000 USD (4.7 billion; 4,700 million); change +12.8% Quelle
- 2026-09-29: Capital expenditure (us-gaap:PaymentsToAcquirePropertyPlantAndEquipment), year to date 2025-12-01 to 2026-08-31: 2,139,000,000 USD (2.1 billion; 2,139 million); same period a year earlier (2024-12-01 to 2025-08-31): 2,105,000,000 USD (2.1 billion; 2,105 million); change +1.6% Quelle
- 2026-09-29: Cash and cash equivalents (us-gaap:CashAndCashEquivalentsAtCarryingValue), as of 2026-08-31: 1,220,000,000 USD (1.2 billion; 1,220 million); previous balance (2025-11-30): 1,928,000,000 USD (1.9 billion; 1,928 million); change -36.7% Quelle
- 2026-09-29: Total assets (us-gaap:Assets), as of 2026-08-31: 50,971,000,000 USD (51 billion; 50,971 million); previous balance (2025-11-30): 51,687,000,000 USD (51.7 billion; 51,687 million); change -1.4% Quelle
- 2026-09-29: Shareholders' equity (us-gaap:StockholdersEquity), as of 2026-08-31: 14,188,000,000 USD (14.2 billion; 14,188 million); previous balance (2025-11-30): 12,270,000,000 USD (12.3 billion; 12,270 million); change +15.6% Quelle
- 2026-09-29: Long-term debt (us-gaap:LongTermDebtNoncurrent), as of 2026-08-31: 21,876,000,000 USD (21.9 billion; 21,876 million); previous balance (2025-11-30): 24,037,000,000 USD (24 billion; 24,037 million); change -9% Quelle
Juni 2026
Carnival Corporation filed its quarterly report for the period ending May 31, 2026, and confirmed no changes in internal controls or executive trading arrangements.
- On June 26, 2026, Carnival Corporation Ltd. filed its Form 10-Q for the quarter ended May 31, 2026, which included the Consolidated Statements of Income (Loss) for the three and six months ended May 31, 2026 and 2025. Quelle
- As of May 31, 2026, the company's chief executive, chief financial, and chief accounting officers concluded that disclosure controls were effective. Quelle
- The company reported that there were no changes in internal control over financial reporting during the quarter ended May 31, 2026, that materially affected those controls. Quelle
- During the quarter ended May 31, 2026, no director or Section 16 officer adopted or terminated any Rule 10b5-1 or non-Rule 10b5-1 trading arrangements. Quelle
- In March 2026, the company announced a share repurchase program of up to $2.5 billion. Quelle
Monatliche Einträge werden von der KI aus den geprüften Berichten und offiziellen Quellen des jeweiligen Monats erstellt (auf Englisch, wie entnommen), jede Zeile verlinkt ihre Quelle; Handlungsstränge bündeln zusammengehörige Entwicklungen über Analysen hinweg mithilfe von Vektor-Embeddings (Amazon Titan Text Embeddings V2). Vorläufiger Kontext, keine Anlageberatung.
Sektorvergleich
Vergleich mit 55 beobachteten Unternehmen im Sektor Industrie (Median Umsatzveränderung +11,9% J/J) aus archivierten SEC-XBRL-Daten.
| Unternehmen | Letzter Umsatz | Umsatz J/J | Operative Marge |
|---|
| Carnival Corp Ltd. CCL | 8,4 Mrd. $ | +3,5% | 26,3% |
| Johnson Controls International plc JCI | 25,7 Mrd. $ | +8,8% | — |
| RTX Corp RTX | 25 Mrd. $ | +11,1% | 13,4% |
| Boeing Co. BA | 24,2 Mrd. $ | +3,9% | 1,5% |
| Fedex Corp FDX | 22,9 Mrd. $ | +11,9% | 4,7% |
| United Parcel Service Inc UPS | 22,9 Mrd. $ | +6,7% | 7,6% |
| Lockheed Martin Corp LMT | 20,7 Mrd. $ | +11,3% | 11,8% |
Jeweils jüngster Berichtszeitraum laut SEC CompanyFacts (XBRL). Geschäftsjahre können abweichen.
Änderungen bei den Risiken
Der 10-Q vom 29. September 2026 im Vergleich zum 10-Q vom 26. Juni 2026: Risikoabsätze, die hinzugefügt oder gestrichen wurden, wörtlich zitiert. SEC
Hinzugefügt (14)
- Forward-looking statements should not be relied upon as a prediction of actual results. Subject to any continuing obligations under applicable law or any relevant stock exchange rules, we expressly disclaim any obligation to disseminate, after the date of this document, any updates or revisions to any such forward-looking statements to reflect any change in expectations or events, conditions or circumstances on which any such statements are based.
- Forward-looking and other statements in this document may also address our sustainability progress, plans, and goals (including emissions and environmental-related matters). In addition, historical, current, and forward-looking sustainability-related statements may be based on standards and tools for measuring progress that are still developing, internal controls and processes that continue to evolve, and assumptions and predictions that are subject to change in the future and may not be generally shared.
- Refer to Note 1 - “General” of the consolidated financial statements for additional discussion regarding Accounting Pronouncements.
Gestrichen (12)
- •$30 million - higher cruise Payroll and related expenses driven by higher crew travel costs resulting from the Middle East conflict
- •$42 million - lower repair and maintenance expenses (including dry-dock expenses)
- •$18 million - lower repair and maintenance expenses (including dry-dock expenses)
Gefunden durch Absatz-für-Absatz-Vergleich der beiden Berichte, ohne KI. Ein neues oder gestrichenes Risiko ist für sich kein Zeichen für Probleme.
Große Fonds (13F)
| Fonds | Aktien | Wert | Veränderung der Aktien | Quartal |
|---|
| BlackRock | 94.329.033 | $2.314.834.472 | -2,1% | Q3 2026 |
| State Street | 57.931.301 | $1.421.634.127 | -0,5% | Q3 2026 |
| Geode Capital Management | 35.908.332 | $879.471.133 | -1,4% | Q3 2026 |
| Fidelity (FMR) | 32.454.594 | $796.435.720 | -9,3% | Q3 2026 |
| Norges Bank (Norway's sovereign fund) | 15.583.012 | $445.206.653 | — | Q2 2026 |
| Two Sigma Investments | 4.921.062 | $120.762.861 | +1.564,1% | Q3 2026 |
| Millennium Management | 4.175.517 | $102.467.187 | -23,4% | Q3 2026 |
| D. E. Shaw & Co. | 2.807.506 | $68.896.197 | -54,1% | Q3 2026 |
| Citadel Advisors | 2.313.699 | $56.778.173 | +4,9% | Q3 2026 |
| Renaissance Technologies | 1.543.065 | $37.866.815 | +213,0% | Q3 2026 |
| Bridgewater Associates | 520.198 | $12.765.659 | — | Q3 2026 |
| Wellington Management | 134.928 | $3.311.133 | +1,0% | Q3 2026 |
| T. Rowe Price | 1.910.689 | $46.889 | +4,1% | Q3 2026 |
Aus den vierteljährlichen 13F-HR-Berichten der großen Fonds, die wir verfolgen, wie gemeldet. Fonds melden bis zu 45 Tage nach Quartalsende, die Positionen können sich seitdem geändert haben. Veränderung: gegenüber dem Vorquartal desselben Fonds. Keine Empfehlung.