Ce qui a changé
Ce qui a changéКомпанія Intuitive Surgical розширює раду директорів з десяти до одинадцяти осіб та призначає Аарона Мартіна незалежним директором з 1 січня 2027 року. Це кадрове рішення змінює структуру управління та супроводжується стандартним пакетом винагороди для нового члена ради.
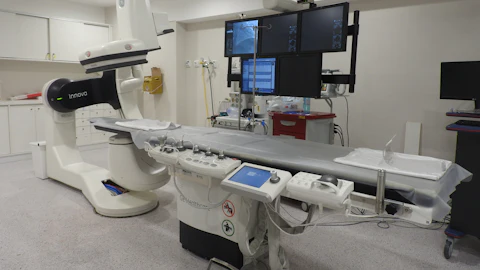
Ce qui a changéLe chiffre d'affaires d'Intuitive Surgical au troisième trimestre 2026 s'élève à 3 049 millions de $, soit 21,7 % de plus qu'un an plus tôt. Le résultat opérationnel recule de 22 %, à 593 millions de $, et le bénéfice net de 25,8 %.

Opérations et participationsIn September 2026, two Intuitive Surgical executives sold shares under Rule 10b5‑1 plans. Mark Brosius, executive vice president and chief manufacturing and supply chain officer, sold 48 shares for $17,140.93 on September 10‑11. Fredrik Widman, vice president, corporate controller, sold 1,089 shares for $407,765.16 on September 15.

Historique de la société
Octobre 2026
INTUITIVE SURGICAL INC: 12 recorded developments from 1 official source in 2026-10.
- 2026-10-21: Net income (us-gaap:NetIncomeLoss), year to date 2026-01-01 to 2026-09-30: 2,162,400,000 USD (2.2 billion; 2,162 million); same period a year earlier (2025-01-01 to 2025-09-30): 2,061,200,000 USD (2.1 billion; 2,061 million); change +4.9% Source
- 2026-10-21: Research and development expense (us-gaap:ResearchAndDevelopmentExpense), quarter 2026-07-01 to 2026-09-30: 408,300,000 USD (408 million); same period a year earlier (2025-07-01 to 2025-09-30): 329,400,000 USD (329 million); change +24% Source
- 2026-10-21: Research and development expense (us-gaap:ResearchAndDevelopmentExpense), year to date 2026-01-01 to 2026-09-30: 1,140,800,000 USD (1.1 billion; 1,141 million); same period a year earlier (2025-01-01 to 2025-09-30): 958,900,000 USD (959 million); change +19% Source
- 2026-10-21: Operating cash flow (us-gaap:NetCashProvidedByUsedInOperatingActivities), year to date 2026-01-01 to 2026-09-30: 3,197,000,000 USD (3.2 billion; 3,197 million); same period a year earlier (2025-01-01 to 2025-09-30): 2,138,000,000 USD (2.1 billion; 2,138 million); change +49.5% Source
- 2026-10-21: Cash and cash equivalents (us-gaap:CashAndCashEquivalentsAtCarryingValue), as of 2026-09-30: 2,978,100,000 USD (3 billion; 2,978 million); previous balance (2025-12-31): 3,368,000,000 USD (3.4 billion; 3,368 million); change -11.6% Source
- 2026-10-21: Shareholders' equity (us-gaap:StockholdersEquity), as of 2026-09-30: 15,986,200,000 USD (16 billion; 15,986 million); previous balance (2025-12-31): 17,824,000,000 USD (17.8 billion; 17,824 million); change -10.3% Source
- 2026-10-21: Revenue (us-gaap:RevenueFromContractWithCustomerExcludingAssessedTax), quarter 2026-07-01 to 2026-09-30: 3,048,700,000 USD (3 billion; 3,049 million); same period a year earlier (2025-07-01 to 2025-09-30): 2,505,100,000 USD (2.5 billion; 2,505 million); change +21.7% Source
- 2026-10-21: Revenue (us-gaap:RevenueFromContractWithCustomerExcludingAssessedTax), year to date 2026-01-01 to 2026-09-30: 8,711,800,000 USD (8.7 billion; 8,712 million); same period a year earlier (2025-01-01 to 2025-09-30): 7,198,500,000 USD (7.2 billion; 7,199 million); change +21% Source
- 2026-10-21: Gross profit (us-gaap:GrossProfit), quarter 2026-07-01 to 2026-09-30: 2,084,300,000 USD (2.1 billion; 2,084 million); same period a year earlier (2025-07-01 to 2025-09-30): 1,662,400,000 USD (1.7 billion; 1,662 million); change +25.4% Source
- 2026-10-21: Gross profit (us-gaap:GrossProfit), year to date 2026-01-01 to 2026-09-30: 5,875,200,000 USD (5.9 billion; 5,875 million); same period a year earlier (2025-01-01 to 2025-09-30): 4,738,000,000 USD (4.7 billion; 4,738 million); change +24% Source
- 2026-10-21: Operating income (us-gaap:OperatingIncomeLoss), quarter 2026-07-01 to 2026-09-30: 592,600,000 USD (593 million); same period a year earlier (2025-07-01 to 2025-09-30): 759,700,000 USD (760 million); change -22% Source
- 2026-10-21: Operating income (us-gaap:OperatingIncomeLoss), year to date 2026-01-01 to 2026-09-30: 2,419,800,000 USD (2.4 billion; 2,420 million); same period a year earlier (2025-01-01 to 2025-09-30): 2,081,200,000 USD (2.1 billion; 2,081 million); change +16.3% Source
Septembre 2026
INTUITIVE SURGICAL INC: 3 recorded developments from 3 official sources in 2026-09.
- Summary: S (open market or private sale): 2 transaction(s) on 2026-09-10 to 2026-09-11, 48 disposed, total value 17,140.93 USD at a weighted average price of 357.1027 USD; owned after the last one: 764 Source
- 2026-09-15: Units to be sold: 2178; aggregate market value: 823153.32 USD; units outstanding: 353278038 Source
- 2026-09-16: Summary: S (open market or private sale): 2 transaction(s) on 2026-09-15, 1,089 disposed, total value 407,765.16 USD at a weighted average price of 374.44 USD; owned after the last one: 1,026 Source
Les synthèses mensuelles sont rédigées par l’IA à partir des rapports et sources officielles vérifiés de chaque mois (en anglais, tels qu’extraits), chaque ligne renvoyant à sa source ; les fils conducteurs regroupent les développements liés entre analyses grâce aux embeddings vectoriels (Amazon Titan Text Embeddings V2). Contexte provisoire, pas un conseil en investissement.
Pairs du secteur
Comparaison avec 36 entreprises suivies dans le secteur Santé (variation médiane du CA : +7,2% sur 1 an), d'après les données SEC XBRL.
| Entreprise | Dernier CA | CA sur 1 an | Marge opérationnelle |
|---|
| Intuitive Surgical Inc ISRG | 3 Md $ | +21,7% | 19,4% |
| Unitedhealth Group Inc UNH | 113 Md $ | -0,4% | 5,8% |
| Mckesson Corp MCK | 111 Md $ | +7,6% | 1,4% |
| CVS Health Corp CVS | 108 Md $ | +5,4% | 3,3% |
| Cigna Group CI | 73,7 Md $ | +5,6% | 3,3% |
| Cardinal Health Inc CAH | 67,5 Md $ | +5,5% | 1,1% |
| Elevance Health, Inc. ELV | 51,4 Md $ | +1,4% | 2,5% |
Dernière période publiée par entreprise selon SEC CompanyFacts (XBRL). Les calendriers fiscaux peuvent différer.
Événements de gouvernance
Documents sur la manière dont la société est dirigée : changements d’auditeur, retraitements, changements à la direction, rapports en retard, radiations, participations au Schedule 13D et lettres de la SEC, du plus récent au plus ancien.
| Date | Événement | Déclaration |
|---|
| 2 novembre 2026 | Départ ou nomination d’un administrateur ou dirigeant (8-K point 5.02) | 8-K |
Tels que déposés auprès de la SEC, lus par code. Une lettre de commentaires fait partie de l’examen courant de la SEC et ne signifie pas en soi un problème ; le point 5.02 couvre les nominations comme les départs ; le Form 25 peut concerner une obligation ou une autre catégorie de titres.
Grands fonds (13F)
| Fonds | Actions | Valeur | Variation du nombre d’actions | Trimestre |
|---|
| BlackRock | 29 561 783 | $12 020 707 694 | -1,5% | T3 2026 |
| State Street | 16 173 422 | $6 576 598 588 | +0,7% | T3 2026 |
| Geode Capital Management | 8 542 334 | $3 458 144 928 | +0,1% | T3 2026 |
| Norges Bank (Norway's sovereign fund) | 4 954 874 | $1 970 454 292 | — | T2 2026 |
| Wellington Management | 3 352 466 | $1 363 213 250 | -11,8% | T3 2026 |
| Fidelity (FMR) | 2 310 391 | $939 474 527 | -45,7% | T3 2026 |
| Capital Research Global Investors | 2 208 824 | $898 174 103 | +42,4% | T3 2026 |
| Citadel Advisors | 1 370 412 | $557 250 632 | +191,5% | T3 2026 |
| Renaissance Technologies | 456 411 | $185 590 405 | -9,5% | T3 2026 |
| Two Sigma Investments | 407 249 | $165 599 661 | -79,4% | T3 2026 |
| ARK Investment Management (Cathie Wood) | 74 399 | $30 252 865 | +5,7% | T3 2026 |
| Millennium Management | 13 020 | $5 294 323 | -96,9% | T3 2026 |
| D. E. Shaw & Co. | 12 847 | $5 223 976 | -96,2% | T3 2026 |
| Bridgewater Associates | 11 560 | $4 700 643 | -40,2% | T3 2026 |
| T. Rowe Price | 9 945 424 | $4 044 108 | -11,6% | T3 2026 |
D’après les rapports trimestriels 13F-HR des grands fonds que nous suivons, tels que déposés. Les fonds déclarent jusqu’à 45 jours après la fin du trimestre : les positions ont pu changer depuis. Variation : par rapport au trimestre précédent du même fonds. Pas une recommandation.