Ce qui a changé
Ce qui a changéDans son rapport du troisième trimestre 2026, Corning Inc a enregistré un chiffre d'affaires de 4,855 milliards de $, soit une hausse de 18 % sur un an. Le bénéfice net a progressé de 58,1 % pour atteindre 680 millions de $, et le bénéfice par action (BPA) dilué s'est établi à 0,78 $, en augmentation de 56 % par rapport à la même période l'an dernier.
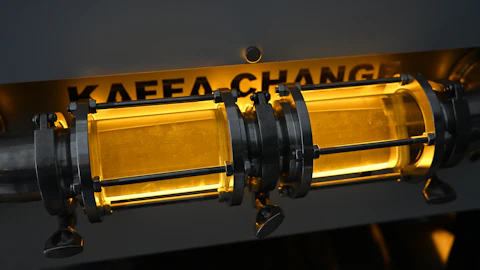
Ce qui a changéAu troisième trimestre 2026, Corning a déclaré 5,08 milliards de $ de ventes principales, soit une hausse de 19 % sur un an. Le bénéfice par action (BPA) principal a progressé de 36 % à 0,91 $, selon le rapport financier de la société en date du 27 octobre 2026.

Ce qui a changéOn September 11, 2026, Corning entered an Equity Distribution Agreement with Goldman Sachs that permits the sale of up to $2 billion of its shares through an at‑the‑market program, with the company paying a 1.0% commission on gross proceeds. Goldman Sachs will act as exclusive agent, the registration statement became effective on April 24, 2026, and Corning confirmed it is not an “ineligible issuer” (as defined in Rule 405).
Historique de la société
Octobre 2026
CORNING INC /NY: 12 recorded developments from 1 official source in 2026-10.
- 2026-10-29: Revenue (us-gaap:Revenues), quarter 2026-07-01 to 2026-09-30: 4,855,000,000 USD (4.9 billion; 4,855 million); same period a year earlier (2025-07-01 to 2025-09-30): 4,100,000,000 USD (4.1 billion; 4,100 million); change +18.4% Source
- 2026-10-29: Revenue (us-gaap:Revenues), year to date 2026-01-01 to 2026-09-30: 13,504,000,000 USD (13.5 billion; 13,504 million); same period a year earlier (2025-01-01 to 2025-09-30): 11,414,000,000 USD (11.4 billion; 11,414 million); change +18.3% Source
- 2026-10-29: Gross profit (us-gaap:GrossProfit), quarter 2026-07-01 to 2026-09-30: 1,810,000,000 USD (1.8 billion; 1,810 million); same period a year earlier (2025-07-01 to 2025-09-30): 1,520,000,000 USD (1.5 billion; 1,520 million); change +19.1% Source
- 2026-10-29: Gross profit (us-gaap:GrossProfit), year to date 2026-01-01 to 2026-09-30: 4,966,000,000 USD (5 billion; 4,966 million); same period a year earlier (2025-01-01 to 2025-09-30): 4,126,000,000 USD (4.1 billion; 4,126 million); change +20.4% Source
- 2026-10-29: Operating income (us-gaap:OperatingIncomeLoss), quarter 2026-07-01 to 2026-09-30: 911,000,000 USD (911 million); same period a year earlier (2025-07-01 to 2025-09-30): 589,000,000 USD (589 million); change +54.7% Source
- 2026-10-29: Operating income (us-gaap:OperatingIncomeLoss), year to date 2026-01-01 to 2026-09-30: 2,248,000,000 USD (2.2 billion; 2,248 million); same period a year earlier (2025-01-01 to 2025-09-30): 1,607,000,000 USD (1.6 billion; 1,607 million); change +39.9% Source
- 2026-10-29: Net income (us-gaap:NetIncomeLoss), quarter 2026-07-01 to 2026-09-30: 680,000,000 USD (680 million); same period a year earlier (2025-07-01 to 2025-09-30): 430,000,000 USD (430 million); change +58.1% Source
- 2026-10-29: Net income (us-gaap:NetIncomeLoss), year to date 2026-01-01 to 2026-09-30: 1,610,000,000 USD (1.6 billion; 1,610 million); same period a year earlier (2025-01-01 to 2025-09-30): 1,056,000,000 USD (1.1 billion; 1,056 million); change +52.5% Source
- 2026-10-29: Operating cash flow (us-gaap:NetCashProvidedByUsedInOperatingActivities), year to date 2026-01-01 to 2026-09-30: 3,140,000,000 USD (3.1 billion; 3,140 million); same period a year earlier (2025-01-01 to 2025-09-30): 1,643,000,000 USD (1.6 billion; 1,643 million); change +91.1% Source
- 2026-10-29: Cash and cash equivalents (us-gaap:CashAndCashEquivalentsAtCarryingValue), as of 2026-09-30: 2,537,000,000 USD (2.5 billion; 2,537 million); previous balance (2025-12-31): 1,526,000,000 USD (1.5 billion; 1,526 million); change +66.3% Source
- 2026-10-29: Total liabilities (us-gaap:Liabilities), as of 2026-09-30: 19,838,000,000 USD (19.8 billion; 19,838 million); previous balance (2025-12-31): 18,669,000,000 USD (18.7 billion; 18,669 million); change +6.3% Source
- 2026-10-29: Shareholders' equity (us-gaap:StockholdersEquity), as of 2026-09-30: 13,671,000,000 USD (13.7 billion; 13,671 million); previous balance (2025-12-31): 11,807,000,000 USD (11.8 billion; 11,807 million); change +15.8% Source
Les synthèses mensuelles sont rédigées par l’IA à partir des rapports et sources officielles vérifiés de chaque mois (en anglais, tels qu’extraits), chaque ligne renvoyant à sa source ; les fils conducteurs regroupent les développements liés entre analyses grâce aux embeddings vectoriels (Amazon Titan Text Embeddings V2). Contexte provisoire, pas un conseil en investissement.
Pairs du secteur
Comparaison avec 89 entreprises suivies dans le secteur Technologies (variation médiane du CA : +20,6% sur 1 an), d'après les données SEC XBRL.
| Entreprise | Dernier CA | CA sur 1 an | Marge opérationnelle |
|---|
| Corning Inc GLW | 4,9 Md $ | +18,4% | 18,8% |
| Apple Inc. AAPL | 479 Md $ | +15,1% | 33,0% |
| Micron Technology Inc MU | 133 Md $ | +256,3% | 74,6% |
| NVIDIA Corp NVDA | 96,2 Md $ | +105,9% | 66,2% |
| Microsoft Corp MSFT | 92,3 Md $ | +18,8% | 49,8% |
| Accenture plc ACN | 74,2 Md $ | +6,5% | 15,4% |
| Dell Technologies Inc. DELL | 47 Md $ | +57,7% | 11,5% |
Dernière période publiée par entreprise selon SEC CompanyFacts (XBRL). Les calendriers fiscaux peuvent différer.
Attentes et réalité
En cours
The Company does not expect the One Big Beautiful Bill Act (OBBBA) to have a material impact on its estimated annual effective tax rate in 2026.
Déclaré le 29 octobre 2026 · Période citée : 2026 · Source · Notre analyse
Pas encore confrontée aux rapports suivants.
In May 2026, the company updated and extended its Springboard plan, including an annualized core sales run rate target of $20 billion.
Déclaré le 29 octobre 2026 · Période citée : by the end of 2026 · Source · Notre analyse
Pas encore confrontée aux rapports suivants.
The company expects to grow core sales in the fourth quarter to a range of $5.2 billion to $5.3 billion.
Déclaré le 27 octobre 2026 · Source · Notre analyse
Pas encore confrontée aux rapports suivants.
The company expects to grow core EPS in the fourth quarter to a range of $0.96 to $1.00.
Déclaré le 27 octobre 2026 · Source · Notre analyse
Pas encore confrontée aux rapports suivants.
Ce que la direction a annoncé dans les propres documents de l’entreprise (objectifs, projets, prévisions ; en anglais, tel qu’extrait), avec la date et la période citée. Les évaluations sont rédigées par l’IA à partir des rapports suivants : provisoires, non vérifiées par un rédacteur, et un rapport ultérieur cohérent n’est pas une preuve. La décision d’un rédacteur les remplace.
Grands fonds (13F)
| Fonds | Actions | Valeur | Variation du nombre d’actions | Trimestre |
|---|
| BlackRock | 62 934 009 | $9 676 733 278 | -4,3% | T3 2026 |
| State Street | 40 675 106 | $6 254 204 299 | -1,1% | T3 2026 |
| Capital Research Global Investors | 35 279 642 | $5 424 704 695 | +42,8% | T3 2026 |
| Fidelity (FMR) | 19 771 652 | $3 040 089 162 | -17,7% | T3 2026 |
| Geode Capital Management | 18 596 705 | $2 852 222 310 | +1,3% | T3 2026 |
| Norges Bank (Norway's sovereign fund) | 10 238 257 | $2 615 157 986 | — | T2 2026 |
| Wellington Management | 10 666 797 | $1 640 126 707 | -19,0% | T3 2026 |
| D. E. Shaw & Co. | 1 692 758 | $260 278 470 | +438,3% | T3 2026 |
| Appaloosa (David Tepper) | 1 129 500 | $153 578 115 | — | T1 2026 |
| Citadel Advisors | 773 371 | $118 913 525 | +109,9% | T3 2026 |
| Millennium Management | 370 296 | $56 936 713 | +39,9% | T3 2026 |
| Two Sigma Investments | 101 414 | $15 593 417 | +158,1% | T3 2026 |
| Bridgewater Associates | 21 303 | $3 275 549 | +1 529,9% | T3 2026 |
| T. Rowe Price | 5 232 958 | $804 620 | -13,7% | T3 2026 |
D’après les rapports trimestriels 13F-HR des grands fonds que nous suivons, tels que déposés. Les fonds déclarent jusqu’à 45 jours après la fin du trimestre : les positions ont pu changer depuis. Variation : par rapport au trimestre précédent du même fonds. Pas une recommandation.

